UX at Mediacoach, Data Visualization Suite for La Liga
Mediacoach is a suite of Data Analysis tools developed by La Liga and Mediapro for coaches, analysts, and technical staff of 1st and 2nd division teams. Through charts, tables, and multimedia content, analysts can easily consume data on player/team performance and progress.
As UX Designer my main roles were:
Understanding complex data processes and top profile users
High accurate definition on Confluence for UI and Dev hands on
Analyzing session recordings and event-based data
Designing multiplatform products: Mobile, Ipad, Desktop suite
HI/LO-FI prototyping for clearly communication and presentation
resume
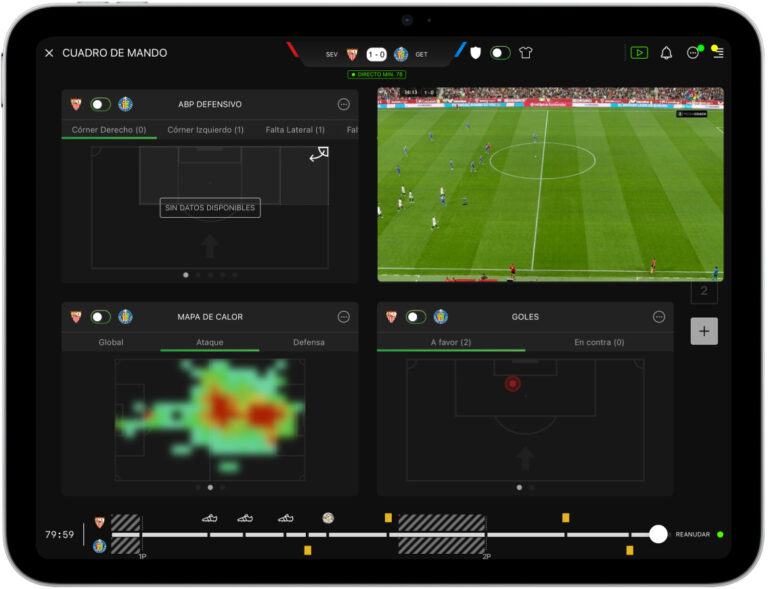
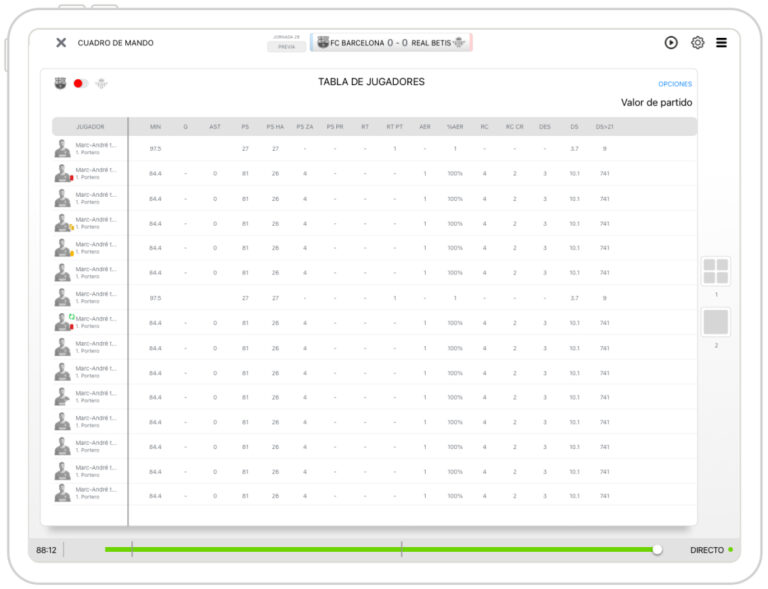
LivePro – Play time and after match review
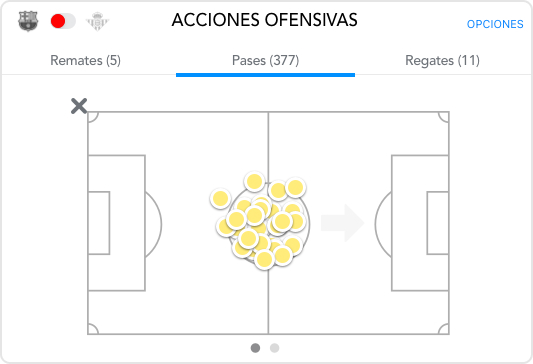
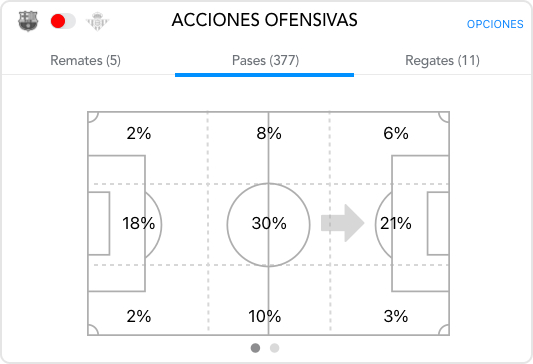
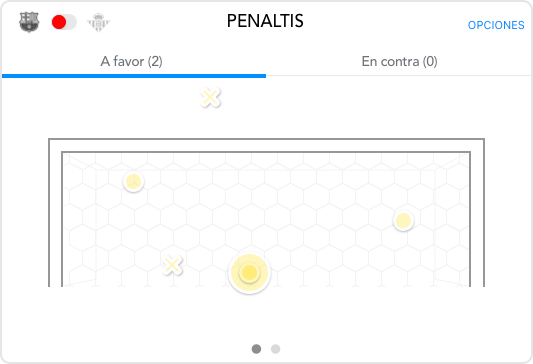
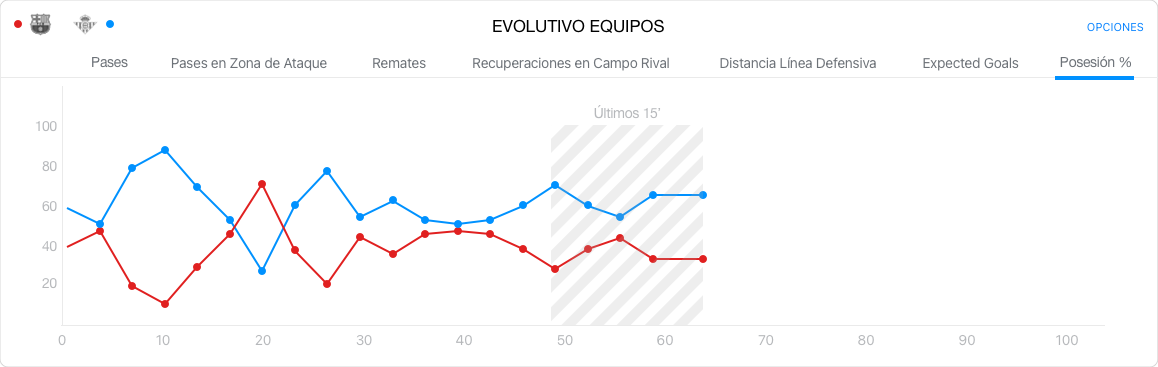
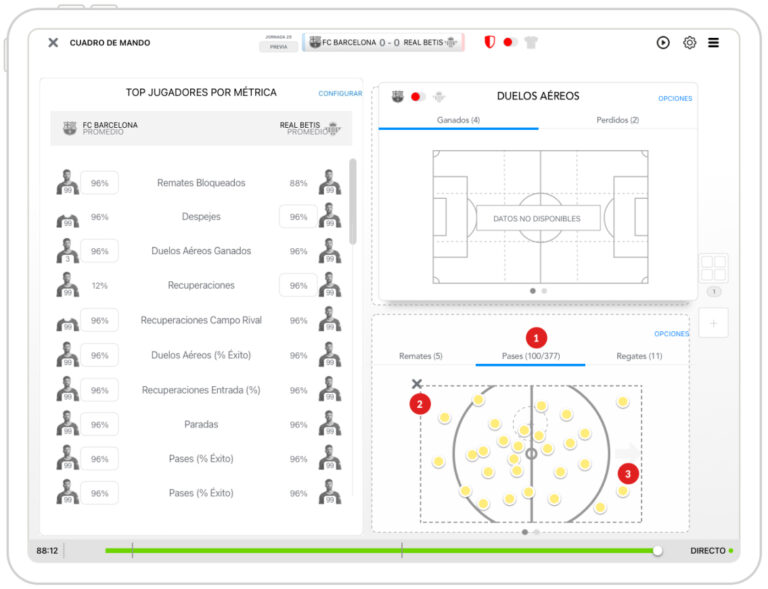
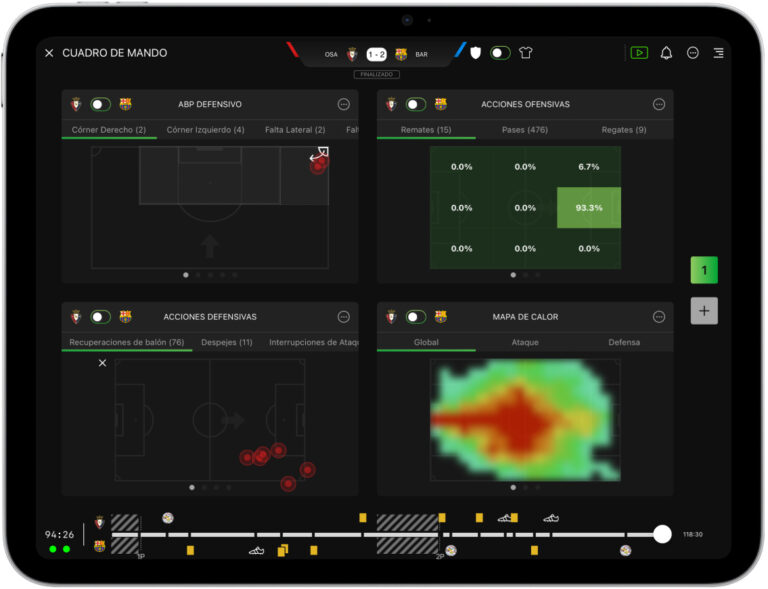
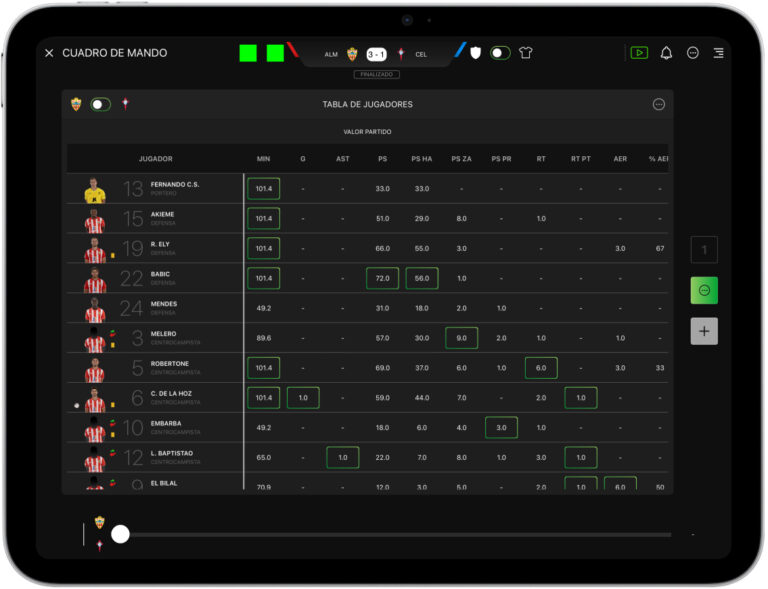
An Ipad tool based on a fast & accesible real time analysis throw chart widgets and video recordings.
As UX Designer I worked defining new features including:
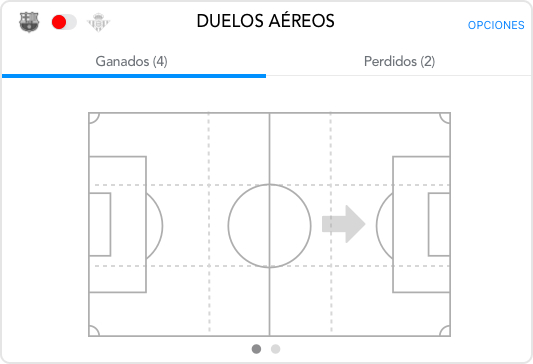
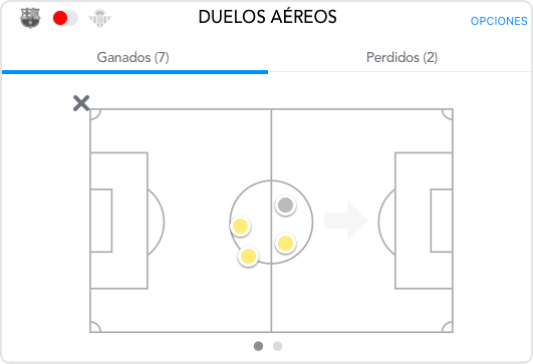
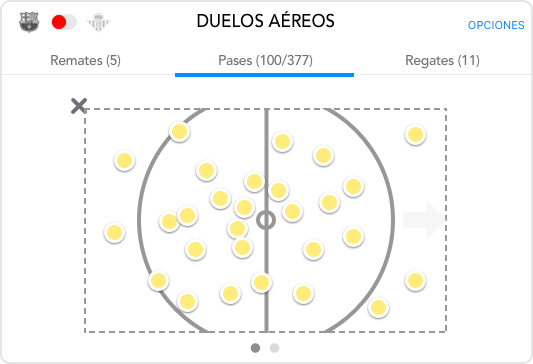
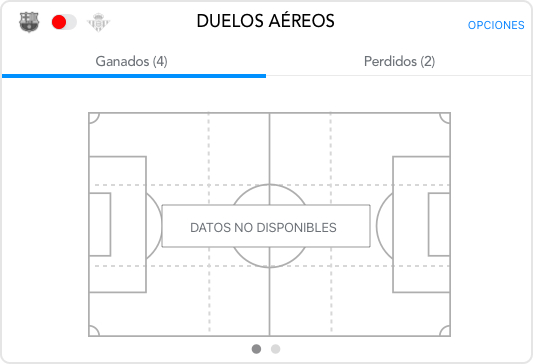
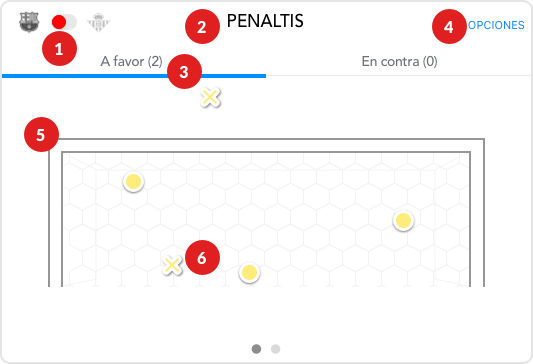
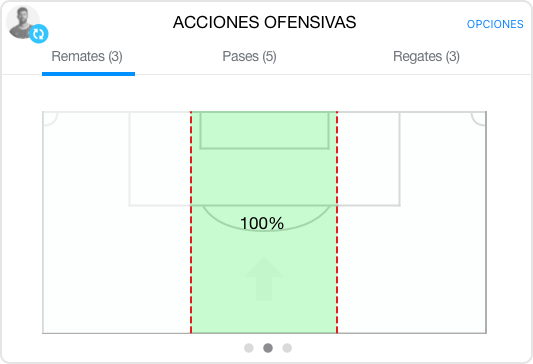
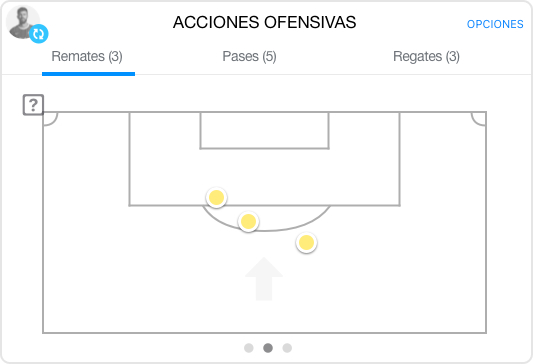
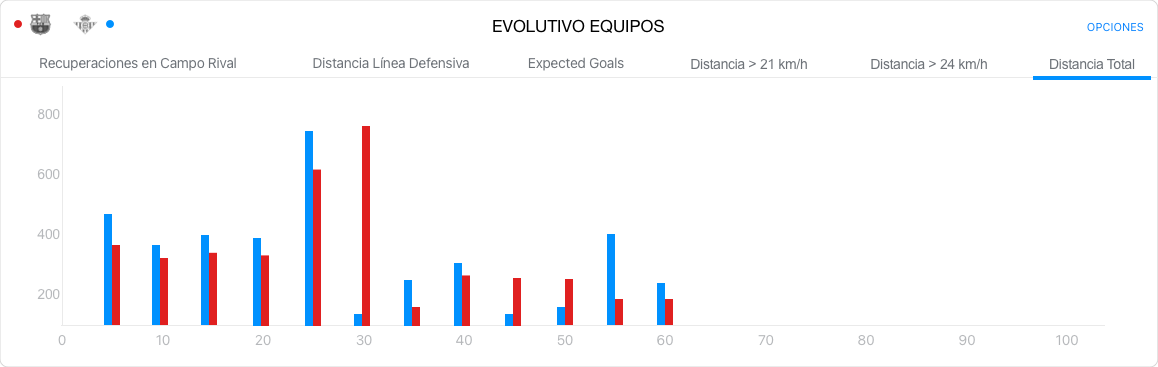
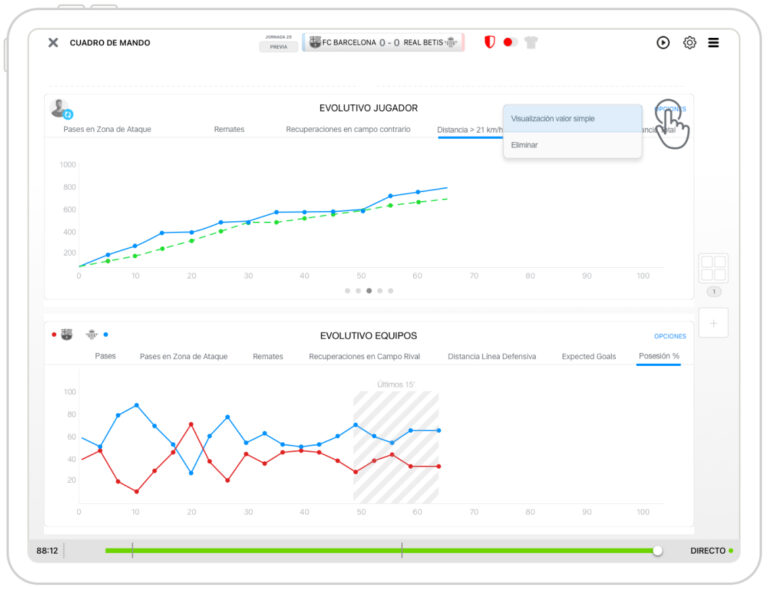
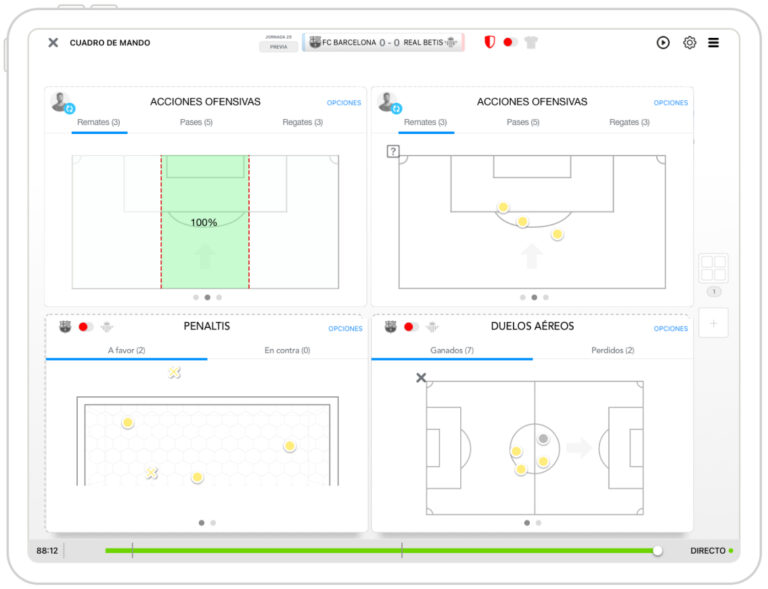
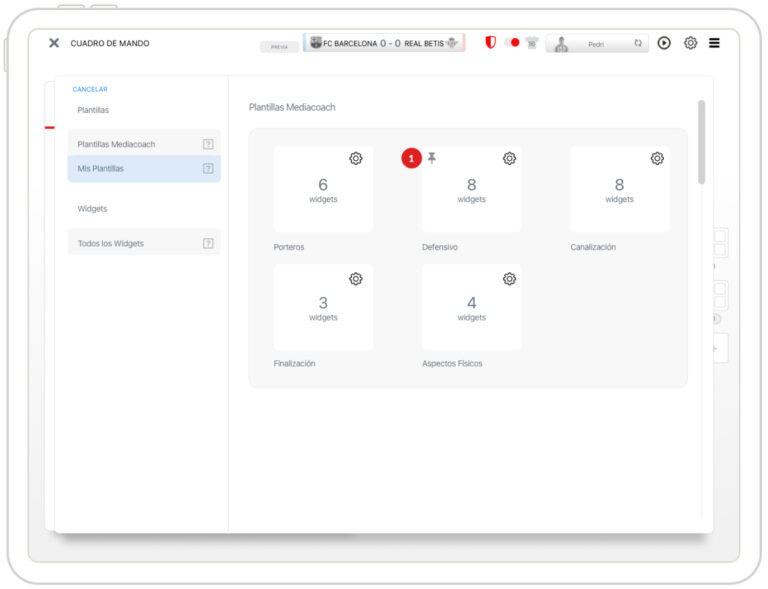
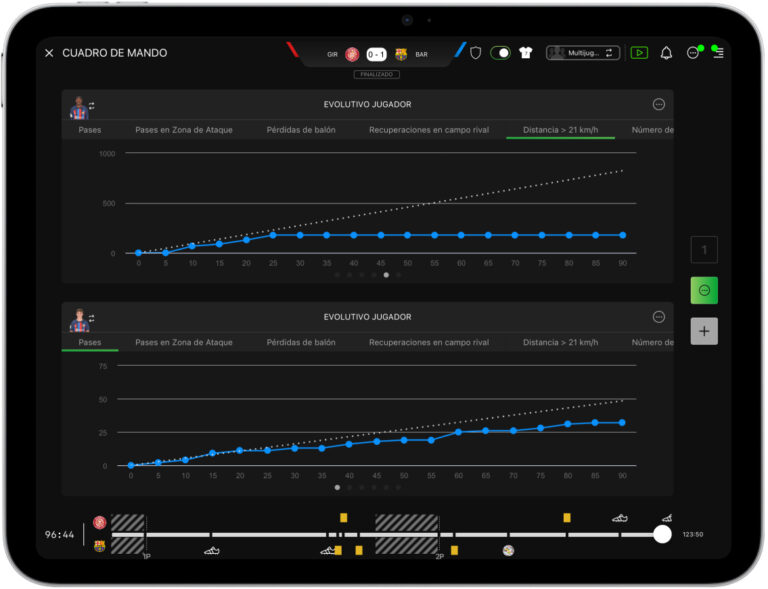
Data visualizaton Widgets As a response of staff new needs I defined some 20 new widgets based on trendline graphics, pin mapping, comparison charts and more
Play Video
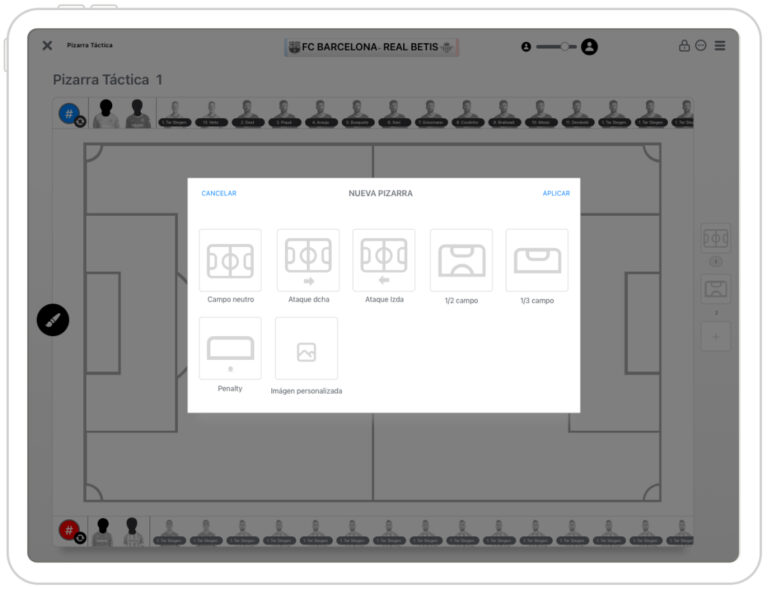
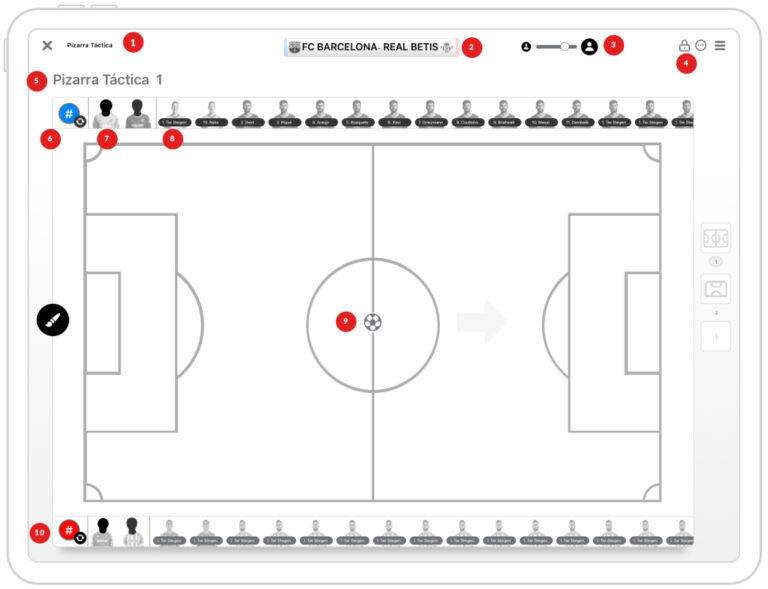
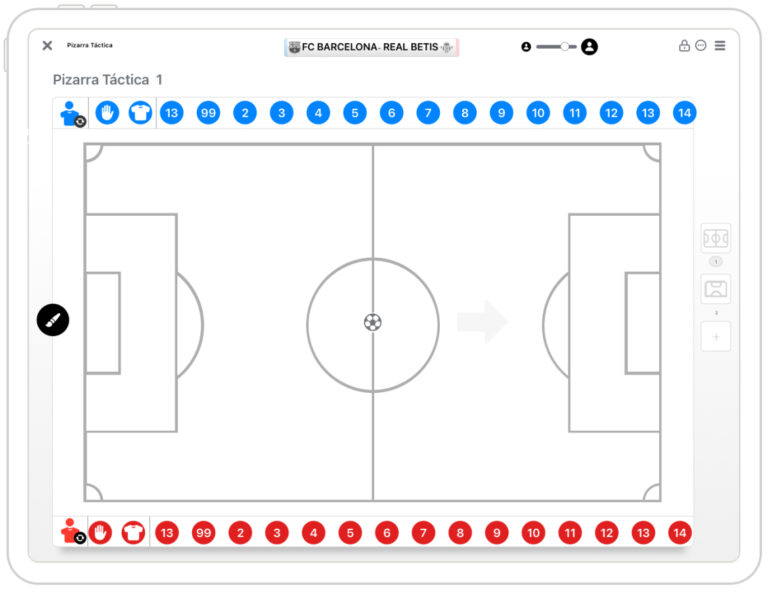
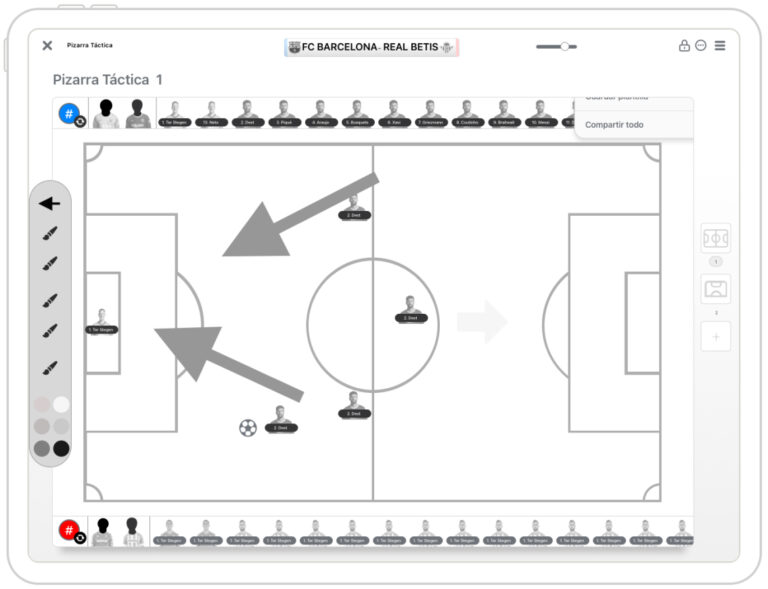
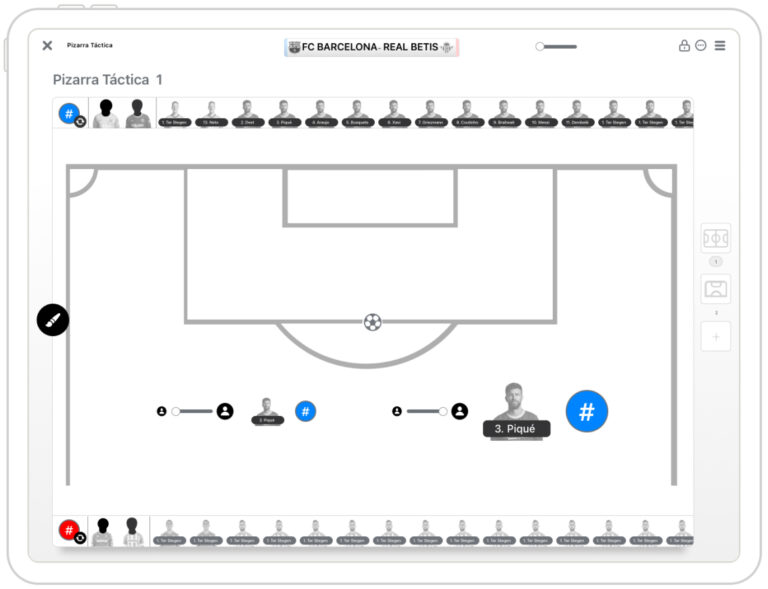
Tactical Whiteboard Quickwin feature that combined the native iOS whiteboard with MC LivePro resources, allowing quick and visual instructions with updated information
Play Video
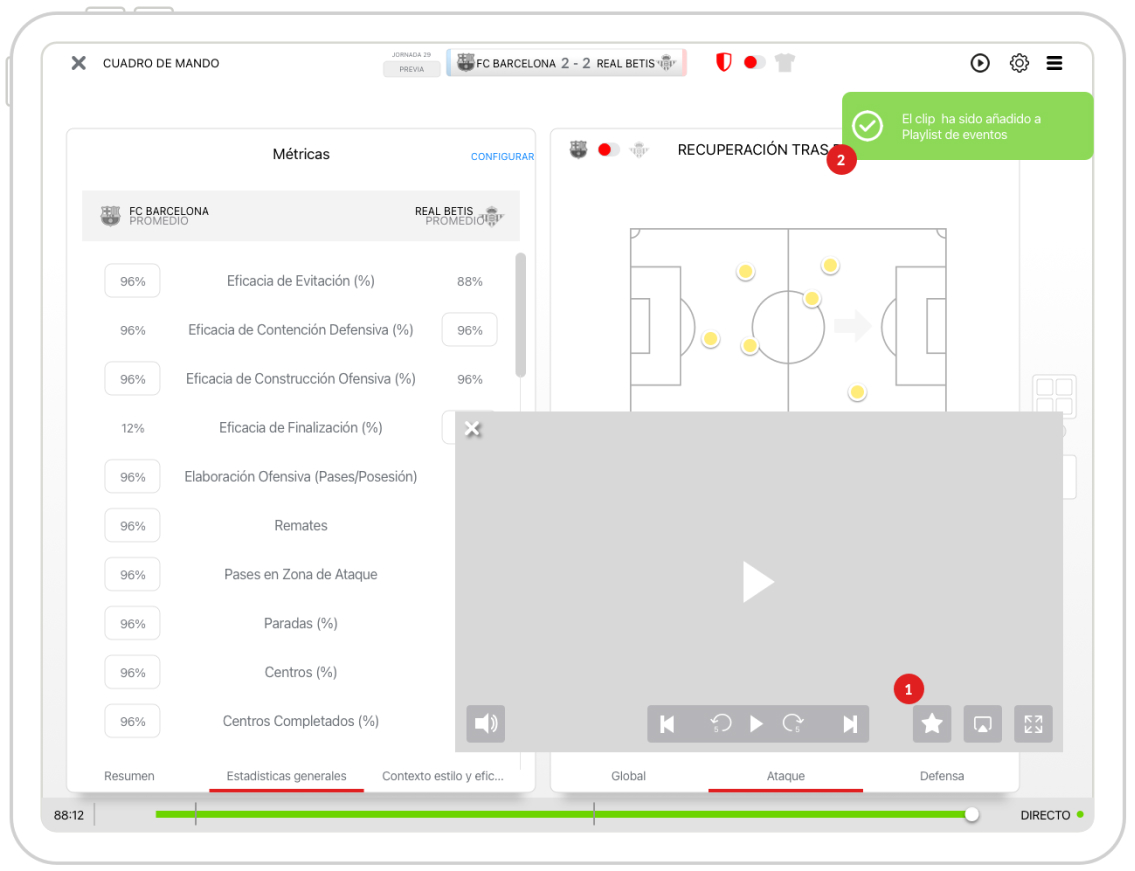
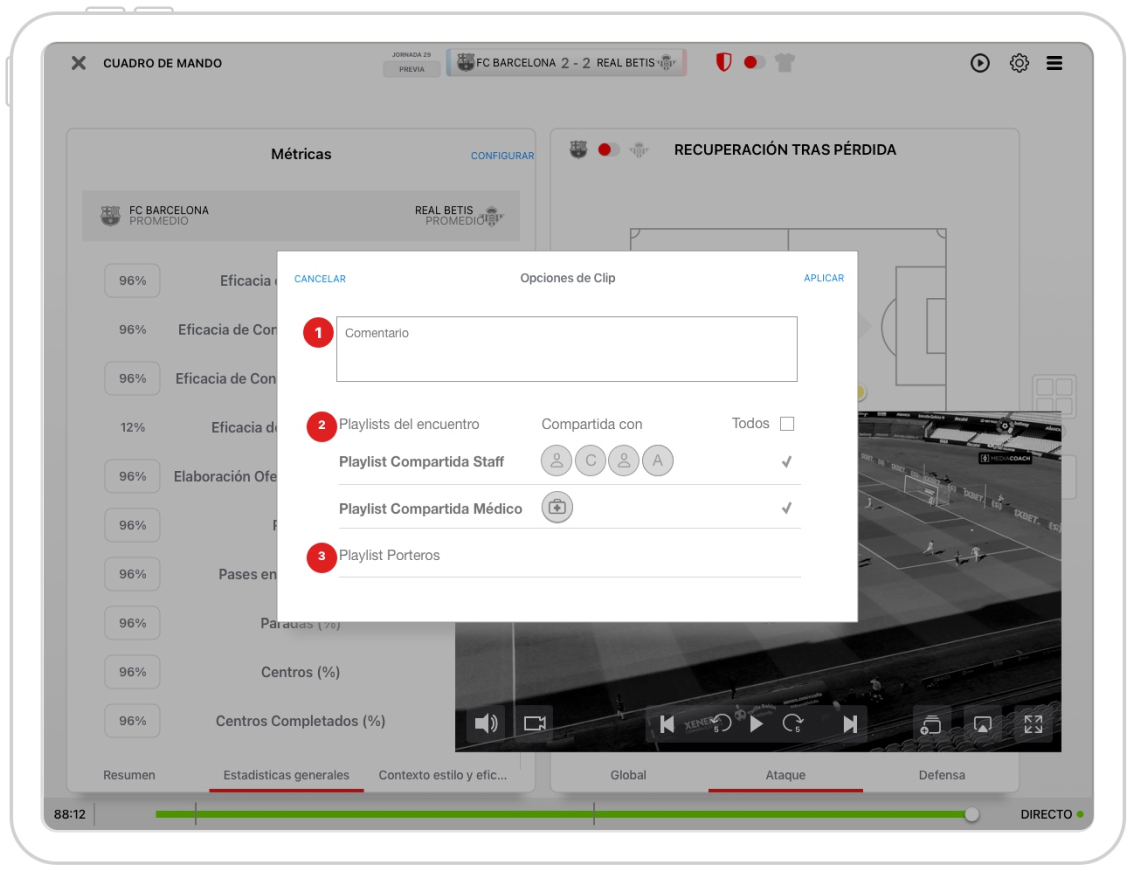
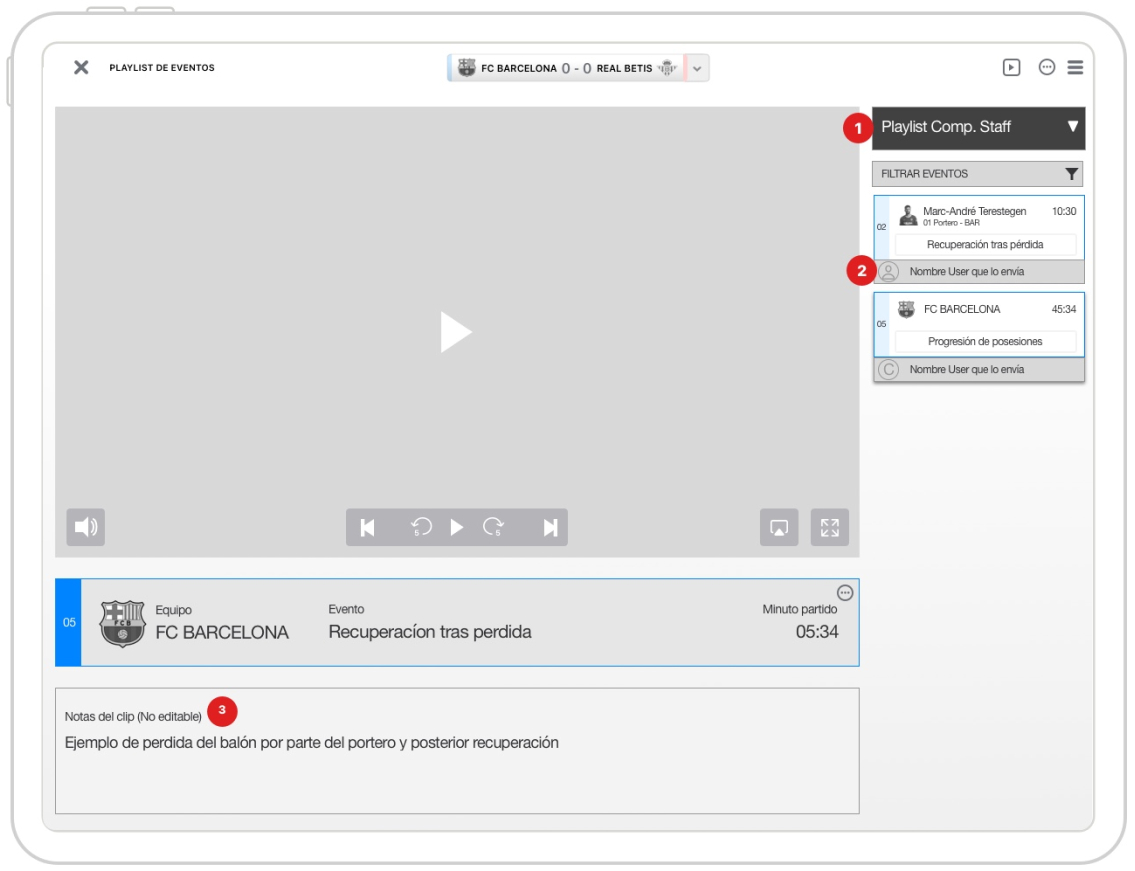
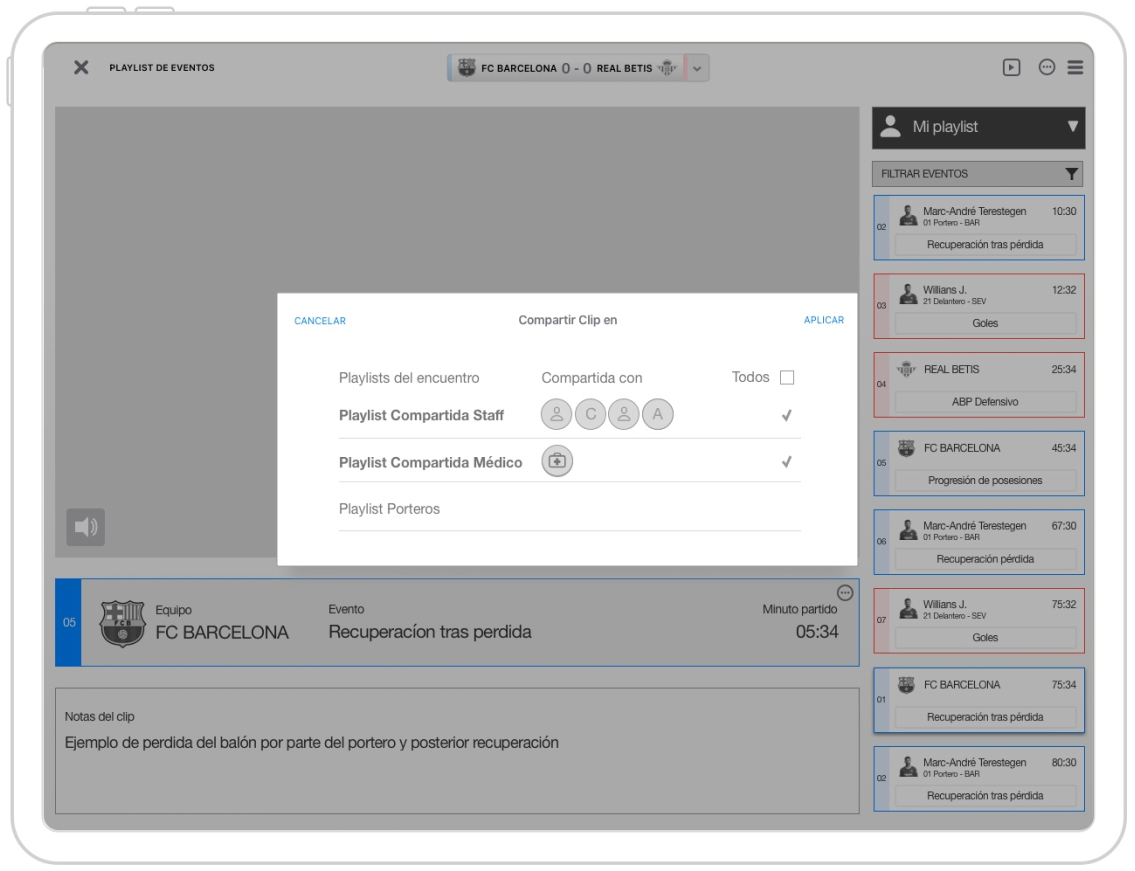
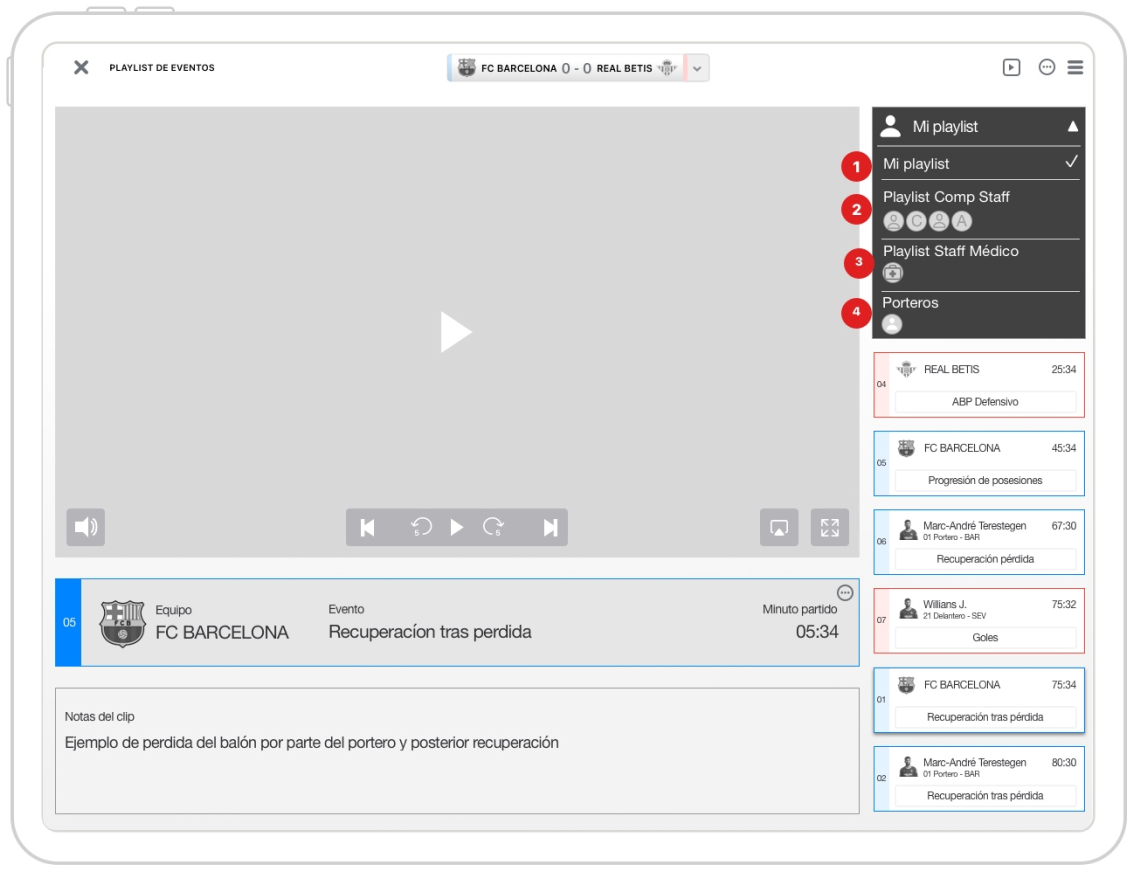
Collaborative Playlist A game changing feature that let create playlists with highlight events and share them with other members of the staff, converting Live Pro on a collaborative tool
Play Video
key takeaways
Main lessons I have learned on those projects:
How to document a project in detail to improve stakeholder understanding, ensure effective version control, and facilitate a smooth handoff to development teams
How a perfect product team should work, including: PO, UX coworkers, UI and Frontend team
Behaviors, interactivity, and advanced rules for data visualization components
let’s connect
Please don’t hesitate to reach out if you would like to have some more information. I will do my best to respond to you in a timely manner. Thanks!